


Ever wondered why a 50% drop in risk sounds so impressive, even when the numbers involved are small? Health studies often discuss two things: relative risk (the percentage change) and absolute risk (the actual chance of an event). Knowing both helps you understand the real benefits of a treatment. In this article, we'll explain each measure and why you need to see the full numbers to make smart choices about your health.
relative risk vs absolute risk explained: Smart Insights
Risk tells us how likely it is for something bad to happen to a person or a group. In health research, two numbers help us understand this chance: absolute risk and relative risk.
Absolute risk is a direct measure of an event happening over a specific time. For example, if 20 out of 1,000 people have a side effect from a medication, then the absolute risk is 2%. That means, on average, 2 out of every 100 people might experience that effect.
Relative risk, on the other hand, compares the chances between two groups. You calculate it by dividing the absolute risk of the group getting the treatment by the absolute risk of the control group. For instance, if the treatment group has a 2% risk while the control group has a 4% risk, the relative risk comes out as 0.5. In simple terms, the treatment group’s risk is half that of the control group. This ratio helps us see how much an intervention might change the likelihood compared to a baseline.
Using both these measures is key to making smart choices about health care. Studies show that if you only talk about relative risk, you might overstate the benefit, especially when the absolute risk is very low. Providing both numbers gives a fuller picture and helps you understand what the risk really means for you.
Example: A report might say a vaccine cuts risk by 95% (relative risk), but for an individual, the chance of having the outcome might drop by only 1.5 percentage points (absolute risk). This shows why it’s important to look at both numbers when making decisions about your health.
Interpreting Relative and Absolute Risk: Common Pitfalls
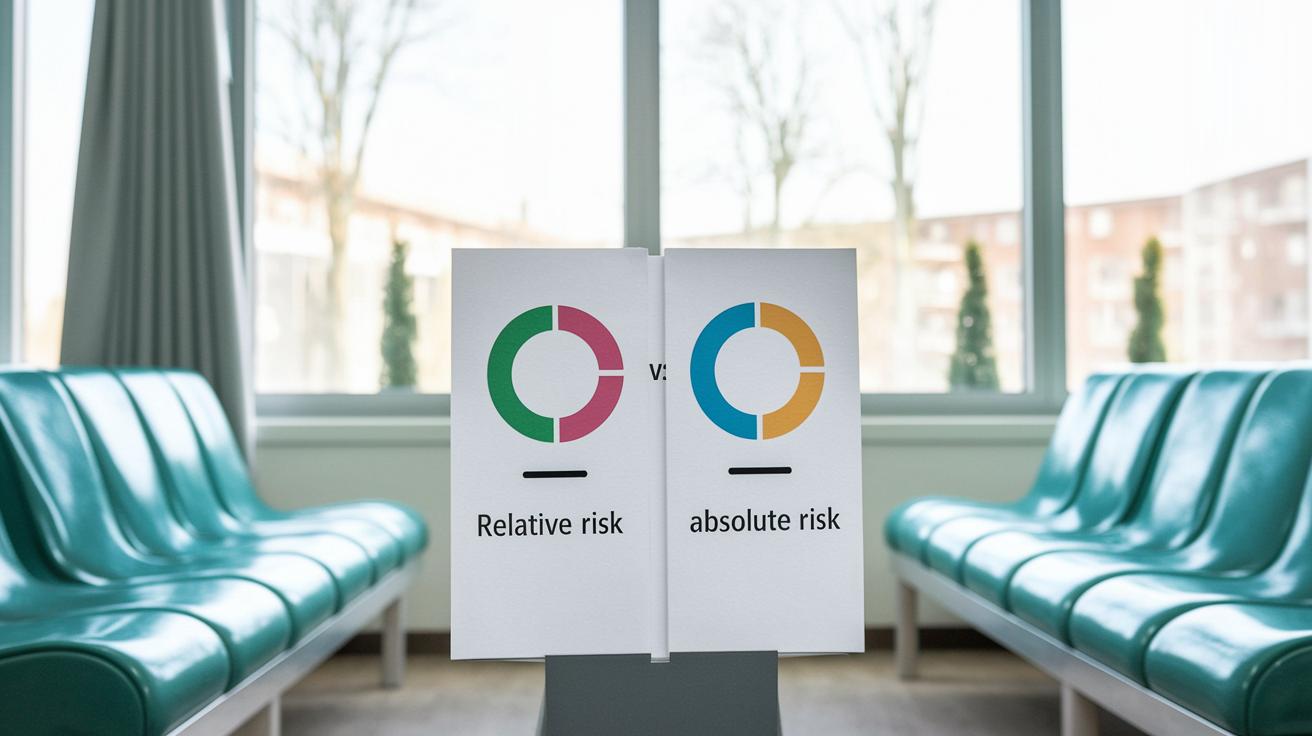
When risk numbers are shared without the full picture, it can be easy to misread what they really mean. A claim like "50% risk reduction" might seem huge at first, but if the risk goes from 2% to 1%, the actual change is small.
Reports on vaccine effectiveness often use numbers like 95% relative risk reduction. While this shows differences between groups, it doesn’t reveal the actual chance of an event for any one person. Factors such as your health, how much you are exposed, and how common the event is in your area all affect your real risk.
Here are five frequent misunderstandings, along with reminders to consider:
- Mixing up relative risk with the change in percentage points from the actual rate
- Not taking the starting (baseline) risk into account
- Assuming that findings from animal studies automatically apply to humans
- Overlooking differences in risk among different groups
- Thinking that a high relative risk reduction always means a big benefit
Keeping these points in mind can help you better understand what the numbers mean for your health.
Calculating Absolute and Relative Risk in Studies
Absolute risk shows the chance of an event happening in a group. To calculate it, you divide the number of events by the total number of people. For example, if 20 out of 1,000 people experience a side effect, the risk is 20 divided by 1,000, which equals 0.02 or 2%.
Relative risk compares the chance between two groups, such as a treatment group and a control group. To find it, divide the absolute risk of the treatment group by the absolute risk of the control group. If the treatment group has a 2% risk and the control group has a 4% risk, the calculation is 0.02 divided by 0.04, resulting in 0.5. This means the treatment group has half the risk compared to the control group.
| Metric | Calculation | Example |
|---|---|---|
| Absolute Risk | Number of events ÷ Total population | 20 ÷ 1000 = 0.02 (2%) |
| Relative Risk | AR in treatment group ÷ AR in control group | 0.02 ÷ 0.04 = 0.5 |
Exploring Absolute and Relative Risk Reduction Metrics
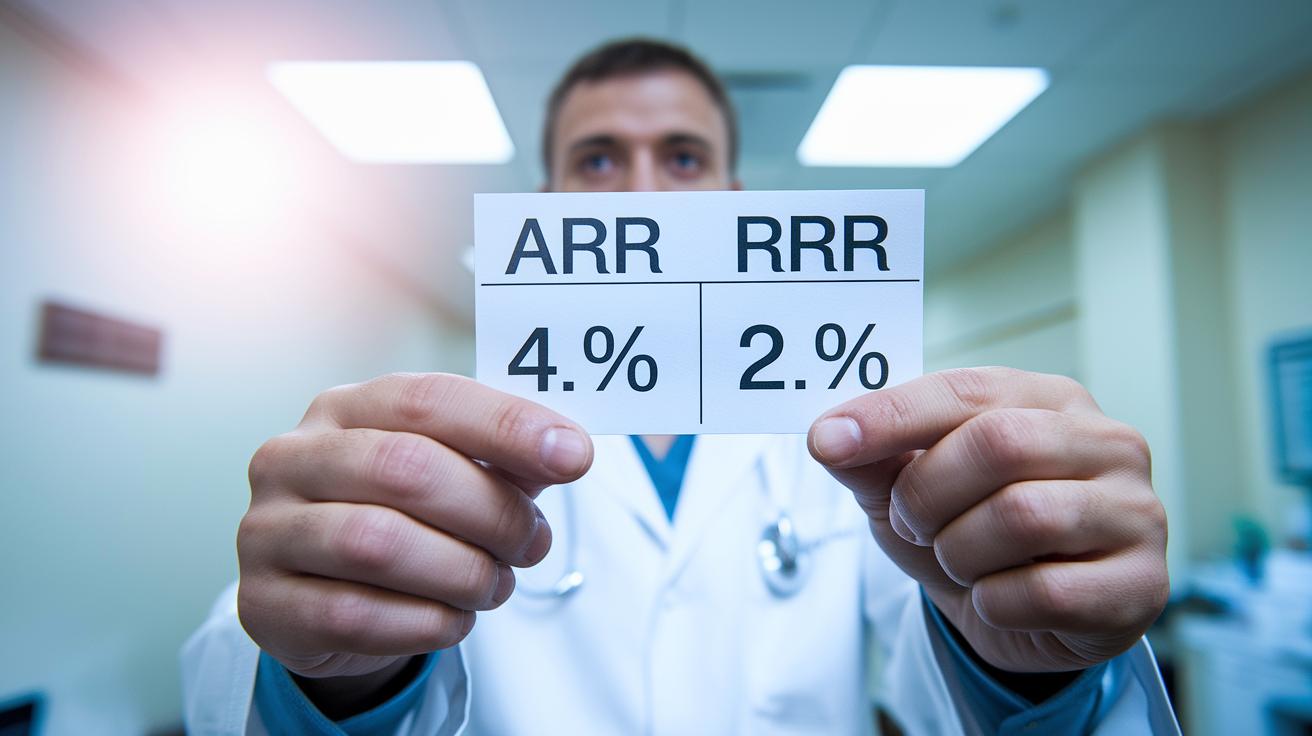
Absolute Risk Reduction (ARR) tells us how much the risk drops when a new treatment is used. To get ARR, subtract the risk in the treatment group from the risk in the control group. For example, if 4% of people in the control group experience an event and only 2% in the treatment group do, the ARR is 2 percentage points. In simple terms, if 4 out of 100 people have an event without treatment and only 2 out of 100 do with treatment, the treatment prevents 2 events per 100 people.
Relative Risk Reduction (RRR) compares this drop in risk to the original risk in the control group. You get RRR by dividing the ARR (2%) by the control group’s risk (4%). This calculation shows a 50% reduction in risk. This metric puts the treatment effect into perspective, showing that the risk is cut in half compared to the original chance. RRR is often used in clinical studies, such as those for vaccines.
Number Needed to Treat (NNT) explains how many people need the treatment to stop one event from happening. You calculate NNT by dividing 1 by the ARR in decimal form. With an ARR of 2% (or 0.02), 1 divided by 0.02 equals 50. This means that 50 people need to be treated to prevent one event, which helps translate the statistics into a real-world impact.
Calculating Absolute and Relative Risk in Studies: Additional Example
In this example, we compare two groups: one not receiving treatment (control) and one receiving treatment. In the control group, the chance of an event is 2%, while in the treatment group it is 1%. This means that the treatment lowers the risk by 1 percentage point.
To break it down further, when you divide the treatment rate (1%) by the control rate (2%), you get 0.5. This shows that the treatment cuts the risk in half. In other words, there is a 50% relative risk reduction with the treatment. When calculated as the Number Needed to Treat (NNT), you find that 100 people need to be treated for one person to benefit.
Here's an easy-to-read table summarizing these measures:
| Measure | Formula | Example Value |
|---|---|---|
| AR control | Events ÷ Total population | 2% |
| AR treatment | Events ÷ Total population | 1% |
| Relative Risk | AR treatment ÷ AR control | 0.5 |
| Absolute Risk Reduction | AR control – AR treatment | 1% (0.01) |
| Relative Risk Reduction | (ARR ÷ AR control) x 100 | 50% |
| NNT | 1 ÷ ARR | 100 |
Consider this simple snapshot: a claim might announce a "50% risk reduction," but in everyday terms, the treatment lowers the risk from 2% to 1%. While the change might seem small, it can be significant when viewed in proper context.
Applying Relative and Absolute Risk in Vaccine Case Study
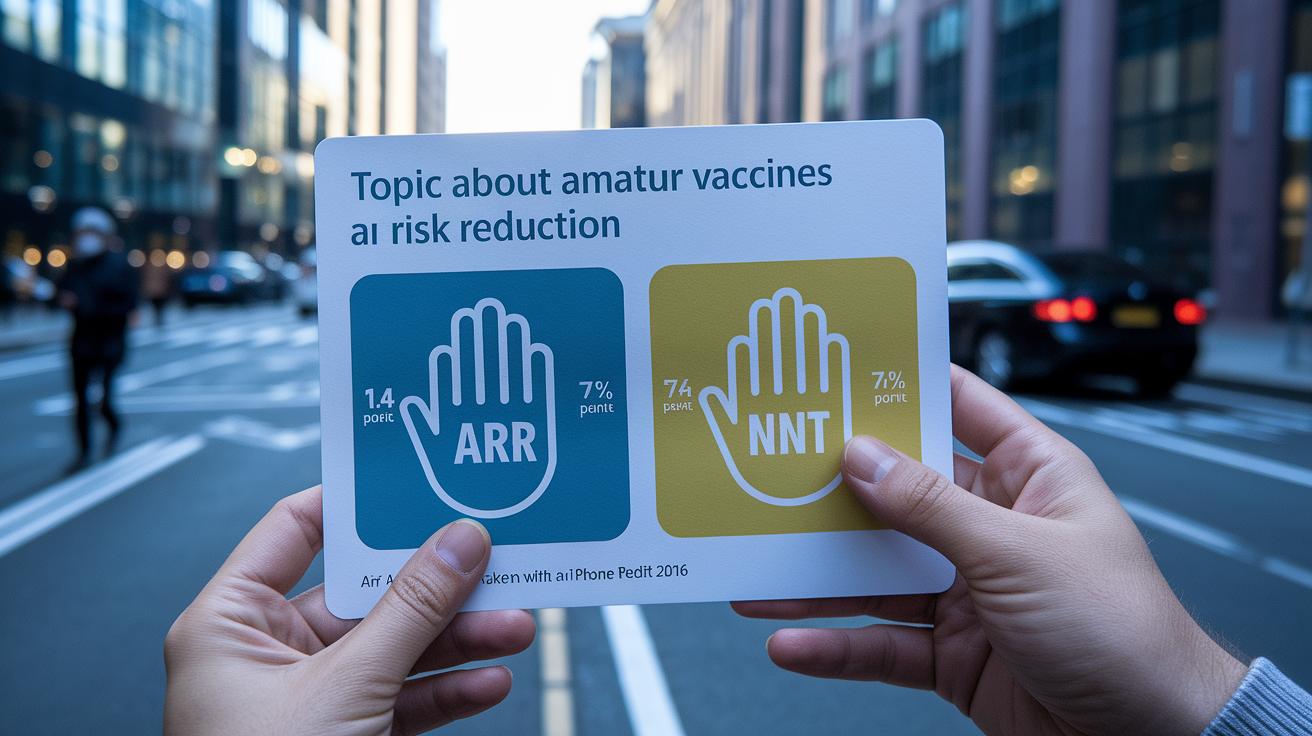
COVID-19 vaccine trials show about a 95% drop in risk when comparing vaccinated people to those on a placebo. In simple terms, while around 1.5% of people in the placebo group might experience a negative event, only about 0.1% of the vaccinated group does. This difference, about 1.4 percentage points, is known as the Absolute Risk Reduction (ARR).
Using this ARR, we can also calculate the Number Needed to Treat (NNT). In this case, roughly 71 people need the vaccine to prevent one adverse outcome from COVID-19. This kind of calculation helps individuals understand the real-world benefit of vaccination.
It is important to remember that trial details matter. Changes in virus spread or individual exposure levels can affect one’s personal risk. While high relative risk reduction gives regulators confidence about group benefits, knowing the ARR and NNT helps people make decisions for themselves.
Bullet-point reminders:
- A high relative risk reduction does not always mean a large change in individual risk.
- ARR offers a clearer picture for personal decisions.
- NNT shows the practical impact of getting vaccinated.
Final Words
In the action, this article explained key statistical measures like absolute risk and relative risk using simple examples and step-by-step formulas. It broke down common misconceptions and showed how these metrics play a clear role in guiding healthcare choices. The vaccine case study made abstract numbers tangible and relevant. With relative risk vs absolute risk explained, you have a firmer grasp on evaluating health claims and making well-informed decisions for yourself and your family.
FAQ
Absolute risk vs relative risk formula
The absolute risk formula calculates the event probability by dividing the number of adverse events by the total population, while the relative risk formula compares this probability between two groups.
Absolute vs relative risk epidemiology
The absolute risk in epidemiology shows the direct chance of an event for a group, whereas relative risk compares the odds between groups to help assess differences in outcome probability.
Absolute risk vs absolute risk reduction
Absolute risk reflects the direct likelihood of an event, while absolute risk reduction is the numerical decrease in risk between a control group and a treatment group.
What is absolute risk
Absolute risk is the chance that a specific event, such as an illness or adverse outcome, occurs in a population, calculated as the number of events divided by the total number of individuals.
Absolute risk formula
The absolute risk formula is defined as the number of events divided by the total population size in the group, offering a straightforward probability measure of an event.
Relative risk vs attributable risk
Relative risk compares the likelihood of an event between two groups, while attributable risk quantifies the excess risk in one group due to a specific exposure compared to an unexposed group.
Relative risk vs relative risk reduction
Relative risk is the ratio of event probabilities between a treatment and a control group, whereas relative risk reduction expresses the percentage decrease in risk relative to the control group’s event rate.
Absolute risk difference
The absolute risk difference, also known as absolute risk reduction, is the arithmetic difference in event probability between two groups, highlighting the true change in risk.
What is the difference between relative risk and absolute risk?
The difference is that absolute risk measures a group’s direct chance of an event, while relative risk compares the experiment or treatment group to a control group to show proportional change.
What does ARR of 0.5 mean?
An ARR of 0.5 indicates that the intervention lowers the chance of an event by 50 percentage points when comparing treatment and control groups, assuming the risk is expressed as a fraction.
What does a relative risk of 1.2 mean?
A relative risk of 1.2 means that the event is 20% more likely to occur in the treatment or exposed group compared to the control or unexposed group.
What is an example of a relative risk?
An example is when a treatment group has a 2% event rate and a control group has a 4% rate, resulting in a relative risk of 0.5, indicating the treatment group experiences half the risk of the control group.